TideTrackers

A Vinalhaven School & Community Citizen Science Project
TideTrackers in the News

TideTrackers is featured in the Maine Monitor's Unstoppable Ocean climate change series – "Vinalhaven: Changing tides and changing minds".

What is TideTrackers?blue and white round logo with words Tidetrackers at the top and Sea Level Rise Committee at the bottom. Logo has icon of house with rising water in the foreground.
TideTrackers is a project of the Vinalhaven Sea Level Rise (SLR) and Climate Committee and the Vinalhaven School with assistance from Knox County EMA. The project monitors the height of water at flood-vulnerable locations on the island. Each month during the highest tides and weather events, volunteer "Tidetrackers" – students and community members – photograph and measure the height of water above Mean High Water (MHW**). Extreme high tides are problematic, causing roadway flooding, ferry cancellations, and erosion. The data collected by the TideTrackers is used to help inform municipal decisions, secure grant funds, and engage the community. 
**Mean High Water – the average of all the high water heights observed over the national Tidal Datum Epoch (currently 1983-2001) NOAA Tides and Currents
 
Interested in becoming a TideTracker Citizen Scientist?
 
Background
TideTrackers was developed by the Vinalhaven Sea Level Rise (SLR) and Climate Committee in an effort to monitor the height of water at a number of flood-vulnerable locations on the island. In 2018, the SLR and Climate Committee hosted a Flood Resilience Checklist Workshop, which brought together over 30 community stakeholders from a variety of sectors to assess Vinalhaven’s vulnerability to flooding. One of the recommendations that came out of the workshop was to increase local data collection and photo documentation efforts. Having watched the impact of coastal flooding over the past several years, the Committee decided to focus on documenting the highest tides of every month, especially extraordinary high tides (often referred to as “King” Tides*) and storm surges with photographs and quantitative data. 
*King tide – a colloquial term that describes exceptionally high tides that occur during a new moon or full moon, several times a year, in coastal areas.

satellite view map of vinalhaven with red location markers and names of seven TideTracker monitoring sites

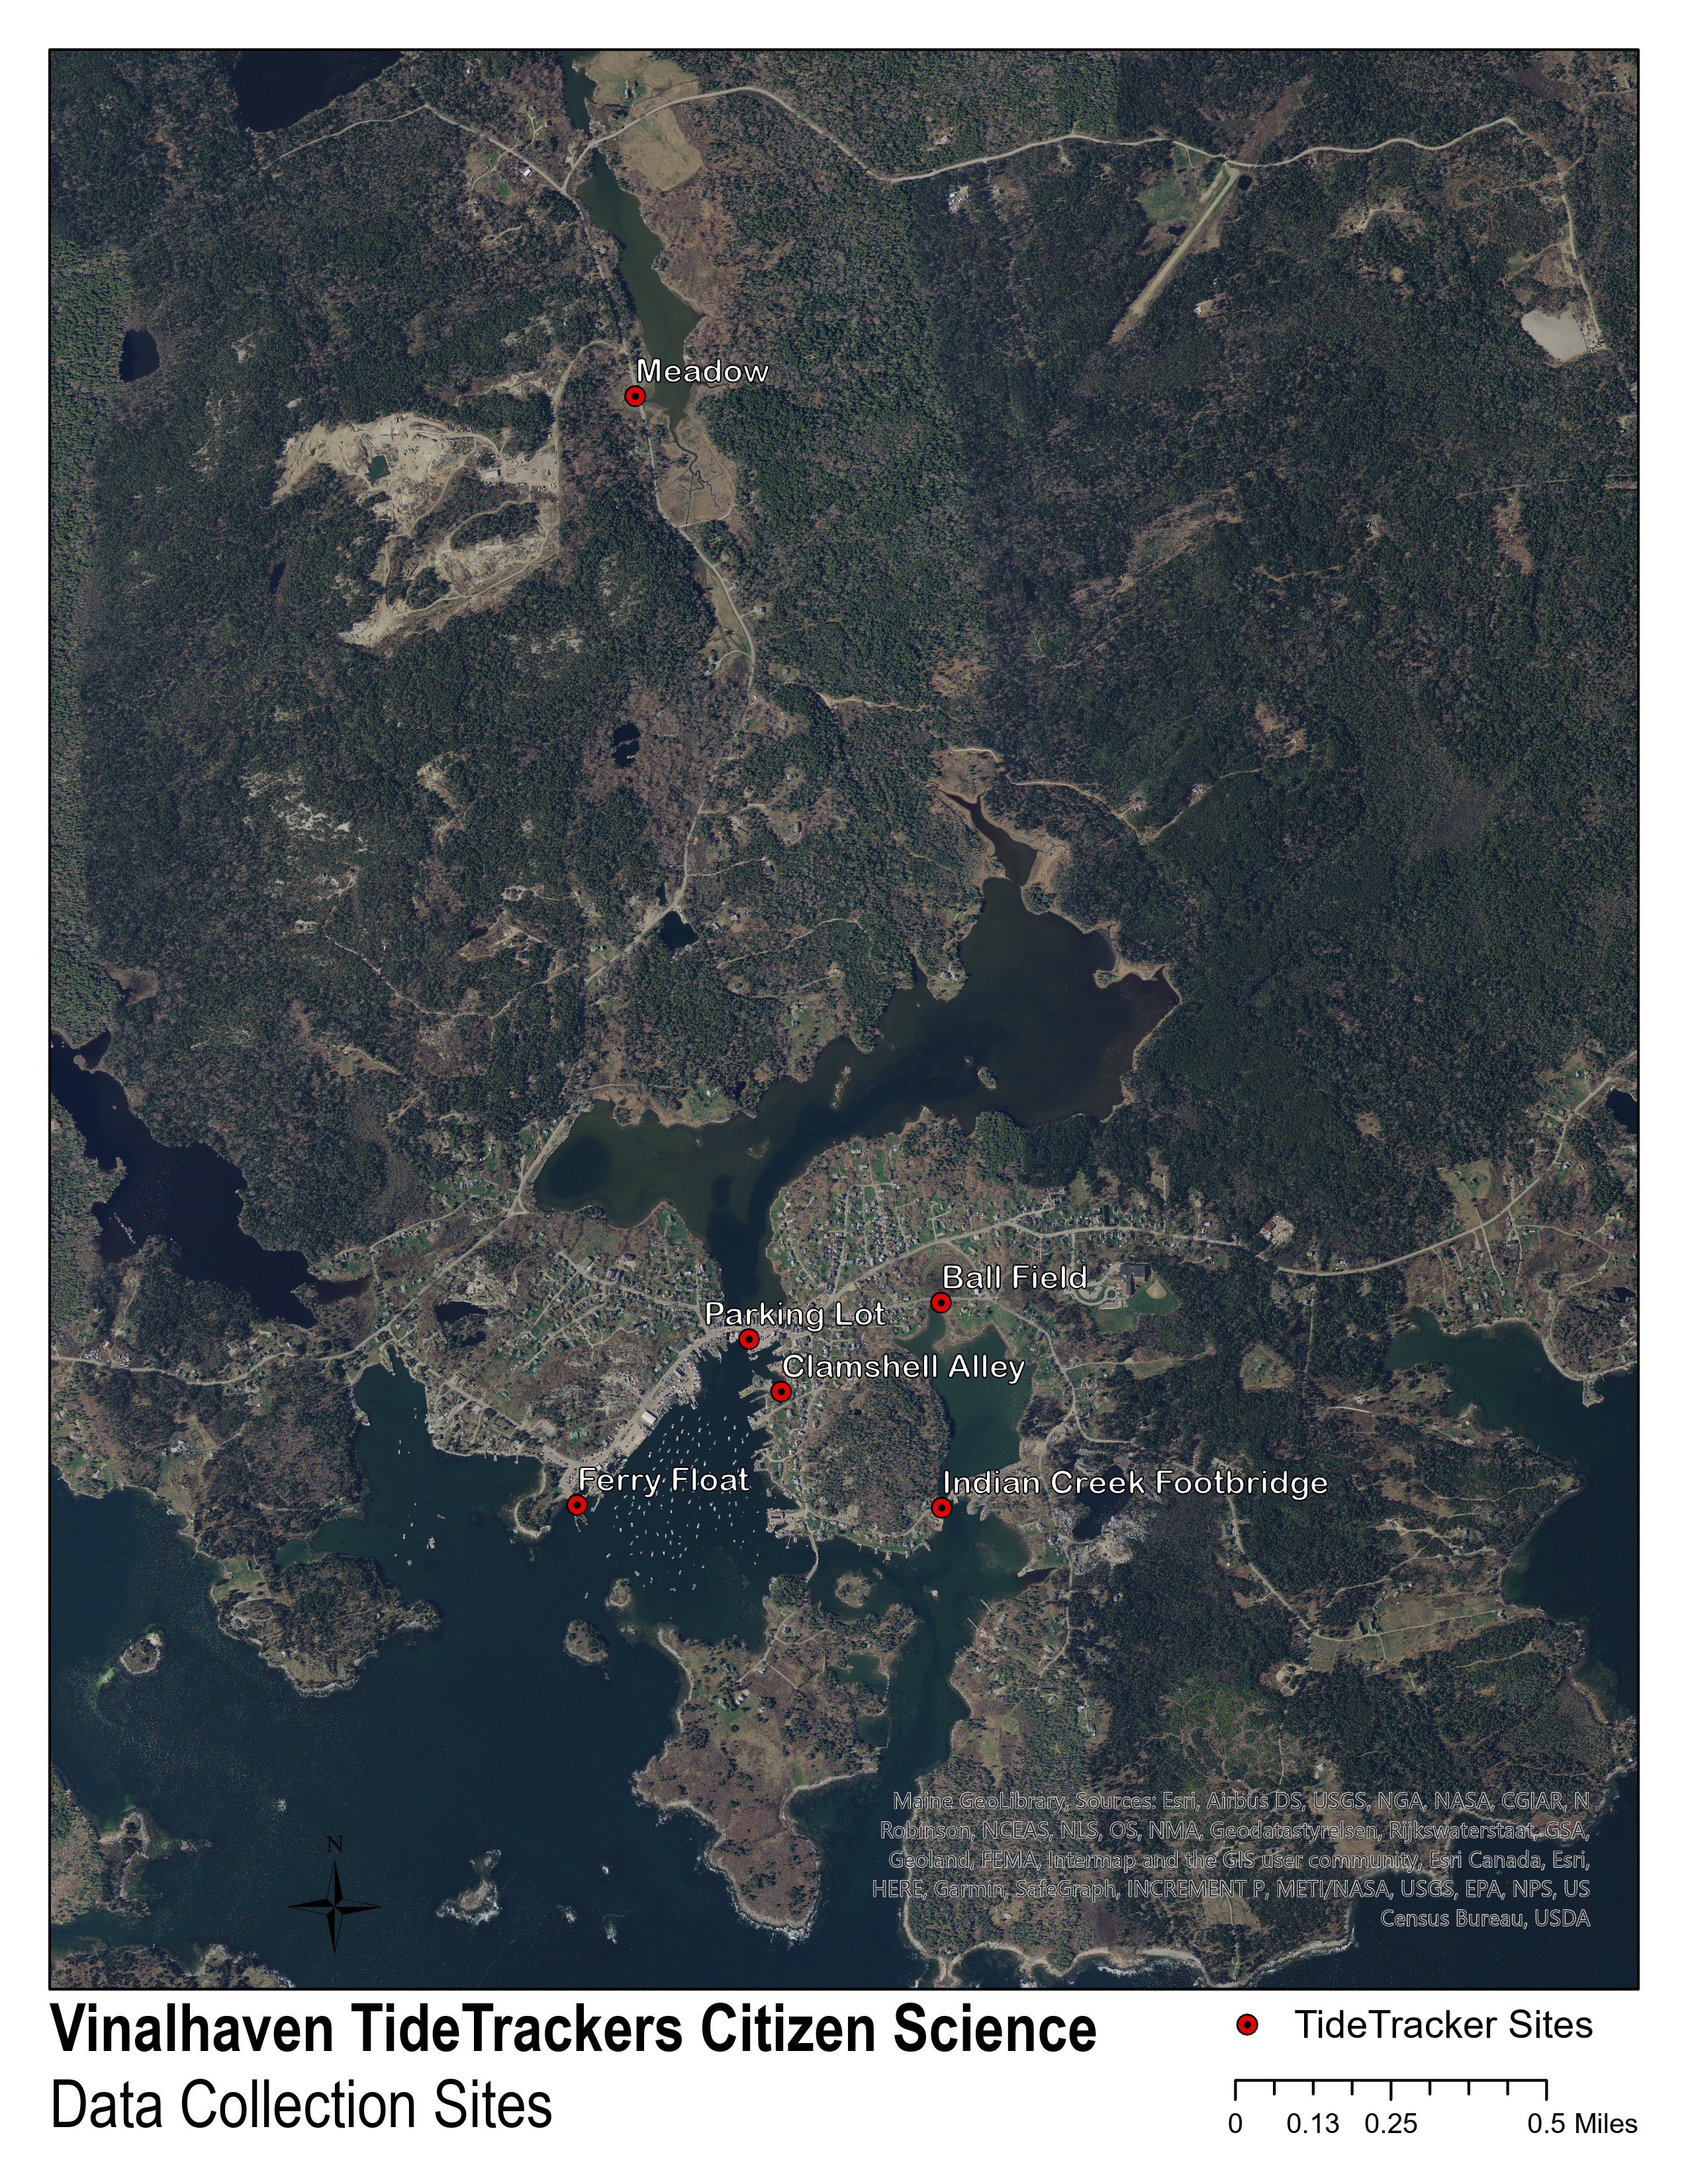
With the assistance of Knox County EMA, the Committee chose 16 “vulnerable locations” around the island, which were particularly susceptible to the impacts of coastal flooding. GPS Coordinates were calculated by visiting each site with a GPS tracker, and the coordinates were then mapped to generate an initial “Vulnerable Locations Map”. The 16 sites were then narrowed down to 7, which were either most safe to access and/or associated with critical infrastructure (e.g. roads, ferry), and this new map of the 7 locations was created. Click Here to view or download a PDF version of the map.

To enable the Committee to collect data at each site, Knox County EMA set up a citizen science data collection survey using the Arc GIS Survey 123 app. The Committee’s chosen strategy was to both photograph and measure, at each site, the height of water above Mean High Water (MHW**) at the highest tides of the month. Of particular interest were the extremely high tides.These are the most problematic tides–causing roadway flooding, ferry cancellations, and erosion.  

**Mean High Water – the average of all the high water heights observed over the national Tidal Datum Epoch (currently 1983-2001) NOAA Tides and Currents

sunny day, man standing by side of road facing tidal marsh and telephone pole with staff gauge man is using smartphone
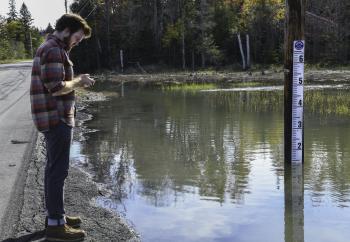
The Committee decided that installing an upright staff gauge (see pic to left) at each site would enable consistent water height measurements. Using a staff gauge prototype based on North Carolina King Tides Project water level gauges, Committee members constructed 10-foot gauges using 1x6-inch Azek pvc boards, and adhering a printed vinyl decal to the board that provided a “ruler”, marked in one-inch increments, by which to measure water levels up to six feet above MHW. On Vinalhaven, MHW is estimated at 9.6 feet– the “zero point”, which would indicate the height at which the gauges would be installed. Before the gauges could be installed, the MHW level for each site had to be identified.

Identifying MHW Level
In order to identify the zero point, or MHW level at each site, the Committee chose a calm day and noted the predicted time and height of the mid-day high tide for that day (using the NOAA tide chart for Vinalhaven). At the time of that high tide, Committee volunteers went to each site and marked on each piling or utility pole–on which the gauges would be mounted–the actual height of water level at that tide. Assuming the predicted and actual high tides would be the same height, the zero point on each piling/pole was identified where the 9.6-foot mark would most likely be.
 
For example, the predicted high tide for the particular day the Committee went was 10.6 feet, so the MHW level mark would be 1 foot below the high tide mark. This assumed, of course, that the predicted high tide and the actual/observed high tide for the day were identical. Using the Bar Harbor Tide Station data as a proxy for Vinalhaven***, it was confirmed that predicted and actual high tide on that day were virtually identical.
***Bar Harbor Tidal Station as proxy for Vinalhaven – Bar Harbor’s Tidal Station is identified as the NOAA “reference station” for the Vinalhaven Tidal Station. Thus, when in doubt, or if data such as hour-by-hour observation of the actual tide height is not available at our station, Bar Harbor is the best nearby reference point. 
 
MHW Details 
To check the method of arriving at MHW, the Committee consulted survey data from the Woodard & Curran designed Municipal Sewer Project for Vinalhaven. Using the Grimes Park Survey Marker as a benchmark, an optical level was used to transfer the established elevation point to confirm the Ferry site gauge was set properly.
 
Locations around the Downtown Parking Lot were checked in a similar manner; but, lacking established survey data, the Meadow site was identified by tidal observation only (high water was 1 hour past NOAA prediction).
 
Gauge Installation
TideTrackers staff gauges were plumb-mounted on existing pilings or utility poles at each vulnerable location site, so that the zero mark on the gauge matched the MHW mark on the piling (Ferry Terminal, Town Parking Lot) or utility pole (Meadow, Ball Ground). At least one gauge (Clamshell Alley fish house) was mounted on framing to allow for plumb installation on the side of a building. Stainless steel lag screws with integrated washers (2-3 for each gauge; lag screws 2-4 inches in length depending on location) were used to install each gauge.
Gauges = 1x6-inch Azek pvc boards
Decals = designed by the Sea Level Rise Committee and printed by a sign and vinyl letter-making company
 
text on page, teal color text boxes with text describing the steps to track data using the Survey 123 app
 
Project Details
SLR and Climate Committee members, community volunteers, and middle school and high school science students volunteer as the “Data Collection Team”, a.k.a. “TideTracker” citizen scientists. The TideTrackers use a Google Calendar to keep track of the highest tides occurring throughout the year. TideTrackers Teams are assigned to monitor 7 vulnerable sites. Each month TideTrackers receive a Google Calendar alert reminding them when to monitor the highest predicted tides. Additionally, a volunteer from the SLR and Climate Committee sends a monthly email reminder to the Teams, suggesting which days are the most critical to document (because tides would be highest) and notifying them of any significant weather makers that could influence water height.
 
TideTrackers use their Arc GIS Survey 1-2-3 data collection smartphone app to enter relevant data and upload photographs of the water height against the gauge as well as additional images of the conditions at the site. For more information about the Survey and how data is gathered, refer to the Team’s Data Collection Cheat Sheet, or click on the image above.
 
Interested in becoming a TideTracker Citizen Scientist?